Financial statements provide a common format for assessing businesses but are diffi cult to read in their raw form.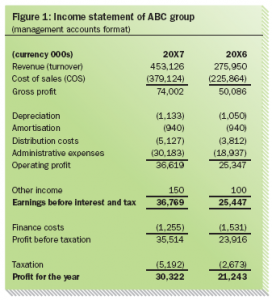 Financial ratios allow interpretation of fi nancial statements to get a better understanding of the fi nancial health of a business. Ratios can be applied historically and to budget or forecast accounts and can be useful both to internal and external analysts of the business. For internal purposes, ratios can be useful in planning, setting goals and evaluating the performance of managers. External users of fi nancial information use ratios to decide whether to extend credit (for example, whether to provide a bank loan), or invest in the company, and to monitor and forecast fi nancial performance.
The term “fi nancial profi ling” refers to the selective use of fi nancial data, ratios and other measures to summarise the key characteristics of a business. Th e essential principles of fi nancial profi ling include:
- the analysis of changes and trends over a number of reporting periods (sometimes known as dynamic analysis, contrasted with single-period static analysis)
- the analysis of the relationships between the changes in related ratios – for example, profi tability may have improved marginally, but only at the expense of unduly increased levels of
 working capital
 - the comparison of ratios with appropriate benchmark fi gures, including those for other fi rms in similar business sectors, or indeed other sectors
- the acquisition of a thorough understanding of the non- fi nancial characteristics of the business
- the linking of the fi nancial ratio analysis with the analysis of the non-fi nancial characteristics of the business
- the setting out of an appropriate summary and conclusion, including a note of any areas needing further investigation.
KEY RATIOS AND PERFORMANCE MEASURES
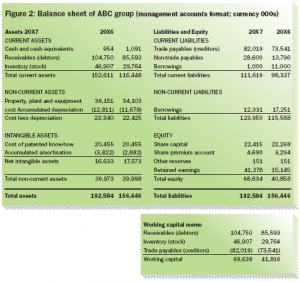
Th e objective here is to review a range of key ratios commonly used to analyse the performance and fi nancial structure of a non- fi nancial sector business. Th ese fi nancial ratios use the balance sheet and income statement. In addition, some will use market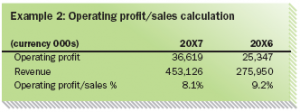 data, such as share price. Ratios using the share price are most useful to equity (shareholder) investors. The key ratios discussed here will be illustrated by reference to the set of primary fi nancial statements for ABC group (see Figure 1 on page 35; Figure 2 on page 39 shows a more complete balance sheet), which distributes goods to the retail sector.
Return on capital employed (ROCE)
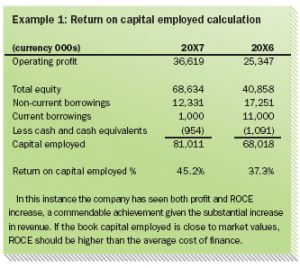
ROCE: profi t ÷ capital employed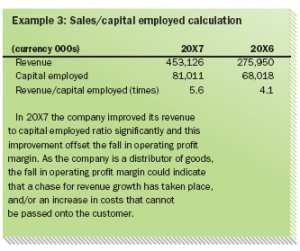
This strict defi nition of ROCE simply begs the question of which profi t and which measure of capital. Most importantly, the profi t fi gure used must be that attributable to the capital being measured, so if total capital (equity plus debt) is used as the capital employed then the profi t should be that attributable to shareholders. Also, analysts are usually interested in calculating a “sustainable” ratio, so they ignore non-recurring items in the profi t measure.
The most common defi nition of ROCE compares the (sustainable) operating profi t of the company with the investment in the company by shareholders and lenders. It is measured by dividing the operating profi t by the capital employed (share capital and reserves plus net debt).
Long-term liabilities (in addition to borrowed money) and provisions may also be included as part of capital employed.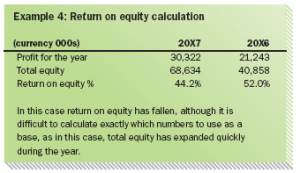 Consistency from year to year is more important than whether or not more debatable items are included.
ROCE1 must be more than the average risk-adjusted rate of return required by capital providers if shareholder value is to be created. It is popular as an internal measure as it can be applied to divisions, subsidiaries or even individual projects and it is easy to understand.
However, both book profi t and capital employed are oft en distorted by accounting practices/policies, and depend on the age and historical cost of fi xed assets (and depreciation policy). For instance, expenditure needed for longer-term value generation (for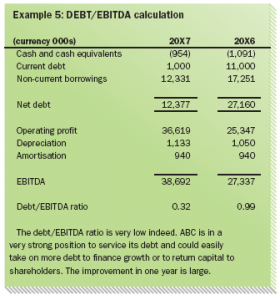 example, research and development) may be avoided because it lowers short-term ROCE.
Operating profit margin and asset revenue
Operating profi t margin: operating profi ts ÷ revenue Asset revenue: revenue ÷ capital employed
Multiplying these two ratios together gives the formula for ROCE because the revenue fi gures cancel each other out.
This is a very important measure strategically as it emphasises that a company can achieve a good ROCE either with a high operating profi t margin but modest revenue to capital employed ratio (such as a highly specialised engineering business), or with a low operating margin but by making very signifi cant use of its assets (such as supermarkets).
Operating profi t margin is a very frequently used ratio, both internally and externally, because it can lead to a good analysis of both pricing dynamics and cost pressures inside a business. Many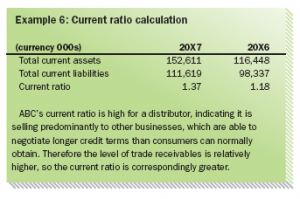 businesses will use this as a key performance indicator (KPI).
Return on equity
Profi t for the year ÷ total equity
This ratio, similar in concept to ROCE, looks at how well the company has performed using the funds that shareholders have supplied to or left within the company, as measured in the balance sheet. It is measured post-interest, thus stripping out debt providers’ rewards, and is post-tax so that the net return on total equity can be seen. It does not show either the returns to shareholders over the year, which is measured by the dividend yield (a concept that will be covered in part 2 of this article, in the next issue of Cash & Trade), nor the capital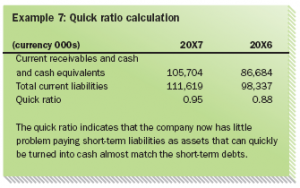 gains on the movement in share prices, nor whether long-term shareholder value has been created that will fl ow to the owners in future years. LIQUIDITY/SOLVENCY Debt/EBITDA Net debt ÷ earnings before interest, tax, depreciation and amortisation
This gives an idea of how well placed the company is to meet its debt obligations and is a very common measure with lenders because it can be applied across many kinds of business. Lenders maintain strict limits on lending and may defi ne limits according to this ratio. EBITDA is a proxy for cash-generative capability. It is essentially cashfl ow available to lenders but it does exclude capital expenditure and many businesses need to spend regularly on capital items.
Although varying with economic conditions lenders (banks) may lend comfortably up to three to four times EBITDA (the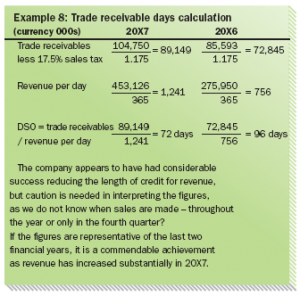 limit for investmentgrade companies), total debt may reach six to seven times EBITDA in a leveraged business, and some financial structures (such as those used by private equity) may reach even higher multiples.
Debt/EBITDA is also oft en used as a fi nancial covenant2 in borrowing agreements and is a very popular ratio. Current ratio Total current assets ÷ total current liabilities
This gives an idea of how well placed the company is to meet its current liabilities from its current assets. however, it should be used with caution as it assumes that the company can turn its current assets to cash in time to meet its liabilities.
Current ratios are highly business-specifi c. For example, supermarkets tend to have low inventories and receivables, but substantial trade payables and so a current ratio well below 1. While a high current ratio indicates good liquidity, it may be a symptom of ineffi cient working capital management3. Acid test (“quick” ratio) Total current assets less inventory ÷ current liabilities
Inventories are the least liquid current asset, as their conversion into cash requires fi rst sale and then collection of the resultant receivables. The acid test mirrors the current ratio but with inventories excluded from current assets – in other words, how well placed is the company to pay its trade payables from more liquid current assets? Th is ratio should be used with caution: if the “acid test” were reality, debtors would probably not pay insolvent suppliers and the true value of receivables might be less than their balance sheet amount. Trade receivable days/Trade payables (liability) days
Trade receivable days: trade receivables ÷ average sales per day (sales/365) Trade payables days: trade payables ÷ average cost of sales per day
Trade receivables can either be the average of the opening and closing balance sheet fi gures, or simply closing receivables (as in the calculations in the next column). Th e formula here gives an average period for receivable collection. Note that it is trade receivables that we are interested in, and a company may have others in the receivables line on its balance sheet. Also, any sales taxes should be deducted from the trade receivables fi gure to match the same treatment of the sales fi gure.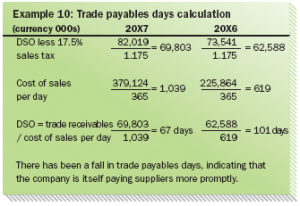
Whether the receivable days fi gure (sometimes referred to as days sales outstanding, or DSO) is good or bad depends on the company’s goals. If DSO has grown from 45 days last year to 60 this year, this might be a negative. On the other hand, a company might have a high DSO fi gure because of a short-term policy of obtaining business in a very competitive market by granting customers long credit periods.
DSO and its purchasing counterpart (days purchases outstanding, or DPO) are very common internal measures and subject to much analysis.
The assumptions used in the calculation are as follows:
- the balance sheet receivables are all trade receivables
- trade receivables (and trade liabilities) include a sales tax element
- sales do not include sales tax
- the average sales tax rate for ABC group is 17.5 per cent.
It is equally possible to make these calculations in reverse and indeed this may oft en be the most frequent use of them for the treasurer.
Inventory ÷ cost of sales per day (cost of sales/365)
This formula gives a guide to the number of days that items for sale are held in inventory. It is sometimes also expressed in terms of inventory “turns” or the number of times inventory turns over in a year:
Inventory turns = cost of sales ÷ inventory or inventory turns = 365 ÷ inventory days
Footnotes: 1 Strictly, operating profi t should be suitably adjusted for tax. Th e capital-employed fi gure should be close to market values for the ROCE calculation to be meaningful. 2 A clause in a contract that requires one party to do, or refrain from doing, certain things. 3 Working capital is current assets less current liabilities but dominated by the major items of trade receivables, trade payables and inventory.
First published in the Cash Management Supplement to the Treasurer, the offi cial publication of the Association of Corporate Treasurers, www.treasurers.org , 2010
Will Spinney is ACT technical offi cer for education. wspinney@treasurers.org
 Cash And Trade Magazine For Cash and Trade professionals in the Middle East

